
A customer reports that checkout is slow. Your on-call engineer opens a dashboard, then another, then a third. Twenty minutes later, the team is still debating whether it’s the database, the payment service or the network.
That’s the problem observability is supposed to solve. Elastic is one of the strongest platforms for it, bringing logs, metrics and traces into one place so engineers can follow a problem to its cause instead of guessing.
But most teams hit a catch a few months in. The observability platform itself becomes something that needs watching.
What Elastic Observability Gives Your Team
Done well, Elastic observability changes how your engineers investigate problems.
Logs tell you what happened. Metrics tell you how the system behaves over time. Traces show the path a single request took through your services, and where it slowed down.
Put those together with the right instrumentation and context, and the slow checkout stops being a mystery. An engineer follows the request through each service it touched, sees which dependency added the delay, and pulls the logs from that exact moment. One investigation, not five dashboards.
Kibana is where your teams search, visualize and investigate. Elasticsearch does the heavy lifting underneath, storing and querying high volumes of telemetry fast enough to be useful mid-incident.
The Hidden Cost of Running Observability Yourself
Here’s what usually happens.
The platform team sets up Elastic for one or two critical applications. It works, so more teams want in. More services start sending logs. Someone asks to keep data for a year instead of thirty days. Traffic grows.
Now the cluster needs attention. Storage fills faster than planned. A major version upgrade is overdue. Query performance has drifted. And nobody has tested whether snapshot recovery actually works, which is the one thing you can’t afford to discover during an outage.
The engineers who built your observability stack end up spending their time maintaining it. The tool meant to keep your services healthy has become another service to keep healthy.
Not every growth problem needs the same fix, either. Longer retention, a heavier query pattern and a jump in traffic each call for a different response. Buying more capacity before you know which one you’re facing spends money without solving anything.
Managed Elastic Observability in Your Own Azure Subscription
This is the gap iVedha Managed Elastic is built to close.
Elasticsearch and Kibana run in your Azure subscription, deployed through an Azure Marketplace Managed Application on Azure Kubernetes Service. iVedha operates the platform. You keep ownership of the environment.
That split matters for three reasons.
- Your data stays in your deployment. Application indices remain in your subscription. Only platform health information is shared with iVedha’s operations environment.
- You keep control of access and governance. Your organization decides how data is used and who can see it, under your existing Azure subscription governance.
- You choose how it connects. Public or private connectivity can be configured to suit your environment.
If you already run workloads on Azure with a partner, this works much like the rest of our cloud managed services: your environment, our operating discipline.
What iVedha Operates, and What Your Team Keeps
A managed service only works when everyone knows who owns what.
- iVedha handles the platform. Monitoring health and capacity, maintenance and version upgrades, and snapshot and recovery operations.
- Your team handles the applications. Sharing growth expectations, deciding what data matters, and confirming services behave as expected after a change.
Your engineers go back to improving the product and investigating real incidents. The observability platform has an owner whose job is keeping it healthy.
Source onboarding and application-specific engineering are scoped separately, so you agree up front what your team handles and where you want implementation help.
Curious how this works at enterprise scale? See how iVedha built an Elastic observability foundation for a financial services firm running hundreds of applications.
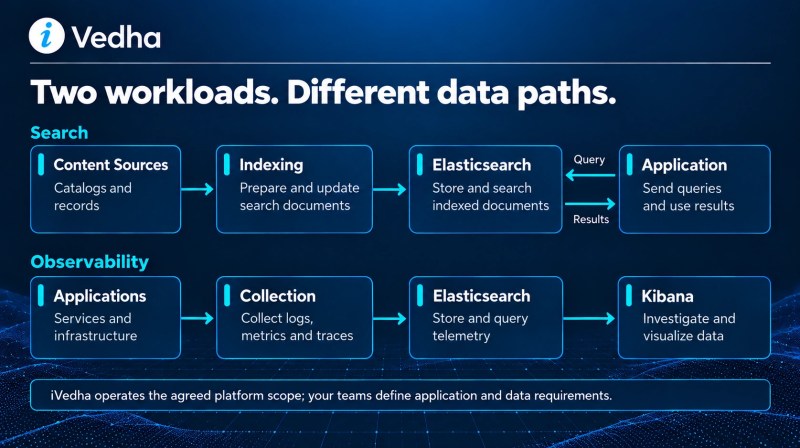
Observability and Search, on Separate Footing
Many organizations that use Elastic for observability also use it for search, whether that’s product search for customers or document search for employees.
The two workloads behave very differently. High-volume telemetry and customer-facing search shouldn’t compete for the same resources. iVedha Managed Elastic supports separate Observability and Search workload profiles, so each deployment fits the job it does.
Experience Beyond the Install
Getting Elastic running is the easy part. Making it useful across a whole organization is harder.
For one large financial services enterprise, iVedha built an enterprise Elastic observability foundation spanning hundreds of applications across multiple lines of business. The work covered log aggregation, automated application onboarding, long-term log archiving and incident management integration. The real challenge wasn’t installing the platform. It was giving every business team a consistent way to use it.
For another, the team turned historical Elastic metrics into predictive capacity forecasting, so operations could spot application-level capacity risks before they hit performance. More examples live in our case studies.
How to Evaluate Managed Elastic Observability
Start small and representative. Pick one service whose requests and dependencies you genuinely need to understand. Use non-sensitive data, and test from the environment your application will actually run in.
Then look past the technical result and test the operating relationship. What work stays with your team? How will growth be reviewed? What happens when you need a change, or help with recovery?
Answer those before production, and you’ll know whether the service fits.
Find Out What Your Observability Problem Really Is
Not sure whether you’re dealing with capacity, retention or query design? Book a conversation with iVedha’s Elastic team. We’ll help you work out which one it is before you spend on the wrong fix, and plan a non-production trial with a real workload if it’s a fit.
Frequently Asked Questions
What is managed Elastic observability?
It’s Elastic’s observability stack, covering logs, metrics and traces through Elasticsearch and Kibana, run by a partner who handles platform monitoring, upgrades, capacity and recovery. Your team focuses on using it, not maintaining it.
Does my data leave my Azure subscription?
No. Application indices remain in your deployment. Only platform health information is shared with iVedha’s operations environment.
How is managed Elastic deployed on Azure?
Through an Azure Marketplace Managed Application, with the core Elastic deployment running on Azure Kubernetes Service inside your subscription.
Can I run observability and search on the same platform?
Yes. Separate Observability and Search workload profiles keep high-volume telemetry from competing with customer-facing search.
Is application onboarding included?
Platform operations are part of the service. Source onboarding and application-specific engineering are agreed as part of the service scope.